
How to build an optimal portfolio?
How to build an optimal portfolio?

How do we build an optimal portfolio? What defines the assets we should hold in our portfolio and by how much or less should we weight them?
As humans we like to group assets together by similar characteristics. For example, wine can take on different characteristics from taste, color, region of origin. Likewise, we do the same with companies. An equity can be characterized by its size, fundamental value or growth potential. A fixed income security can be characterized as either government or corporate. And physical assets like Platinum or Gold can be uniquely characterized by their atomic number on the periodic table.
The great thing is we can simplify an assets characteristic between two variables, return and risk, measuring each across time. Now we can ponder new questions. It would be great to own a high returning asset, right? How about low risk? A high returning and low risk asset, that would be phenomenal! Unfortunately, as you will see, this does not exist. This brings up the concept of risk vs return. In order to have return one must take on risk. That is the universe we live in. The good news is we can literally bend these rules a bit. More on that later.
Below I have collected data points on six different asset classes over time, Equities (S&P500), 3-month U.S. Treasury bills, US Treasury Bonds, Corporate Bonds, Real Estate, and Gold back to 1928. The chart below measures historical mean returns on the y axis and volatility on the x axis.

We can define risk in different ways, one method is volatility, which shows the dispersion of an assets return across time. This chart is very helpful in understanding the relationship between risk and reward. Notice the greater the risk, the greater the expected return. It is linear in nature.
This chart also brings to mind the different investors out there in the world. Some investors may simply want to preserve capital and hold only T Bills or corporate bonds, while others, will aspire for the greatest risk and return and hold only the S&P 500. This spectrum of investors exists for a number of reasons, preferences for certainty vs uncertainty, differing investment horizons across age and ability, financing for large and small companies and a whole host of thousands of other types of investor preferences.
We can now ponder about constructing a portfolio utilizing these assets to achieve different goals for different investors. What if we combined different asset classes together. Could we somehow achieve greater returns with less risk? Below I’ve simulated 100,000 portfolios each with a different weighting towards the above asset classes.

By the way in finance, we call this process mean variance optimization. It is the development of a long-standing notion developed by Harry Markovitz, called Modern Portfolio Theory.
Back to the chart. Notice the curve. Something very interesting is happening here. It is no longer perfectly linear between risk and return. Different holdings of asset classes create different portfolios that lean towards the upper left of the chart. That is greater return for less risk. Thats great! This is the power of diversification before our eyes.
This curve that we see, we call this the efficient frontier. A rational investor would not want to hold any portfolio less than the efficient frontier. Why? It would be suboptimal. Any portfolio on the frontier is where we obtain the greatest return for the risk we take.
Two important portfolios are plotted on this curve. The minimum variance portfolio in blue and the optimal risky portfolio in red. That optimal risky portfolio provides us the greatest return per unit of risk. This is where we maximize the risk adjusted ratio of return to risk. We use something called the Sharpe Ratio. That is defined as the expected return minus the risk-free rate divided by the volatility of returns. Given where we are in yields today, I’ve assumed a 3.8% risk free rate. You might wonder what asset class weightings are in there. Before we get there, I want to go through different holdings of asset classes to illustrate this point of diversification. We want to get as close to that upper left-hand corner as possible.
Let us start off with a traditional Stock and Bond portfolio. Those magenta plots are portfolios with different weightings across the S&P500, T-Bills, T-Bonds, and corporate bonds.
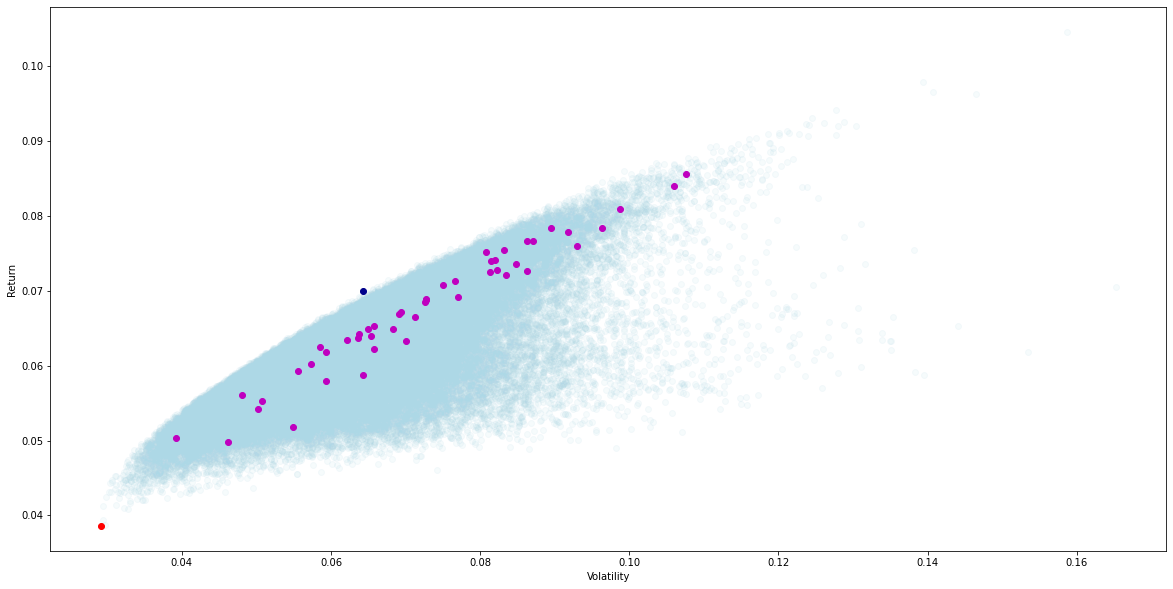
Not quite there.. What if we add some Real Estate to the portfolio what happens then?
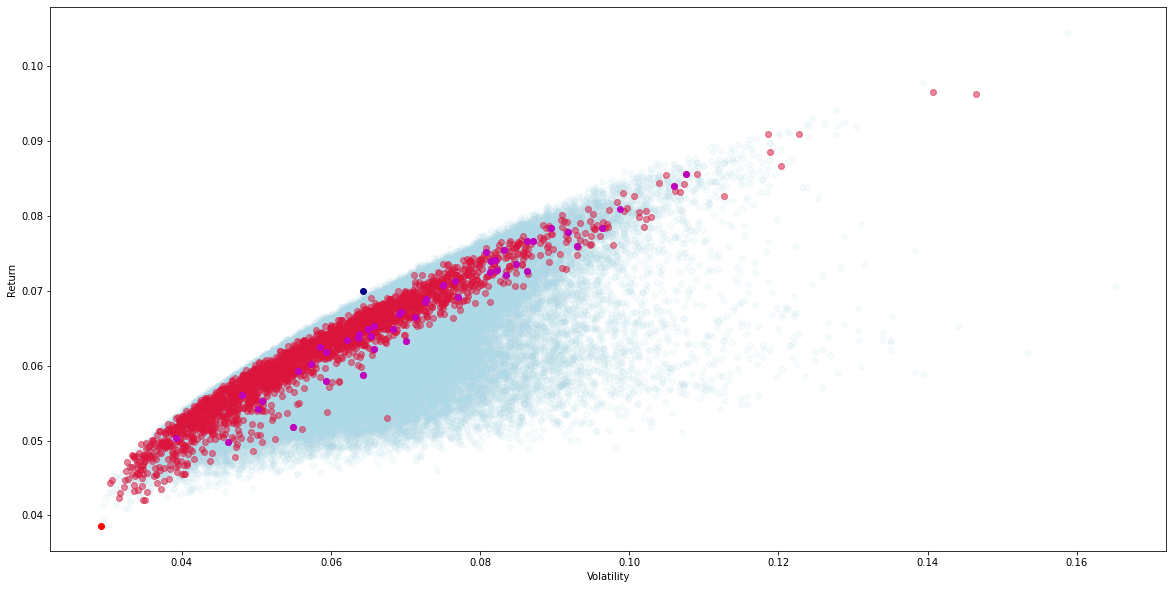
Close but no cigar. Instead of Real Estate, what if we sprinkle some Gold in the portfolio?

Almost there. How about all asset classes together? This time, to get to that final battle ground, I’m going to exclude every portfolio that doesn’t have at least 10% in Stocks, 10% in Corporate Bonds, 10% in Real Estate and 5% in Gold. You’ll see how that little bit of Real Estate and Gold helps out.
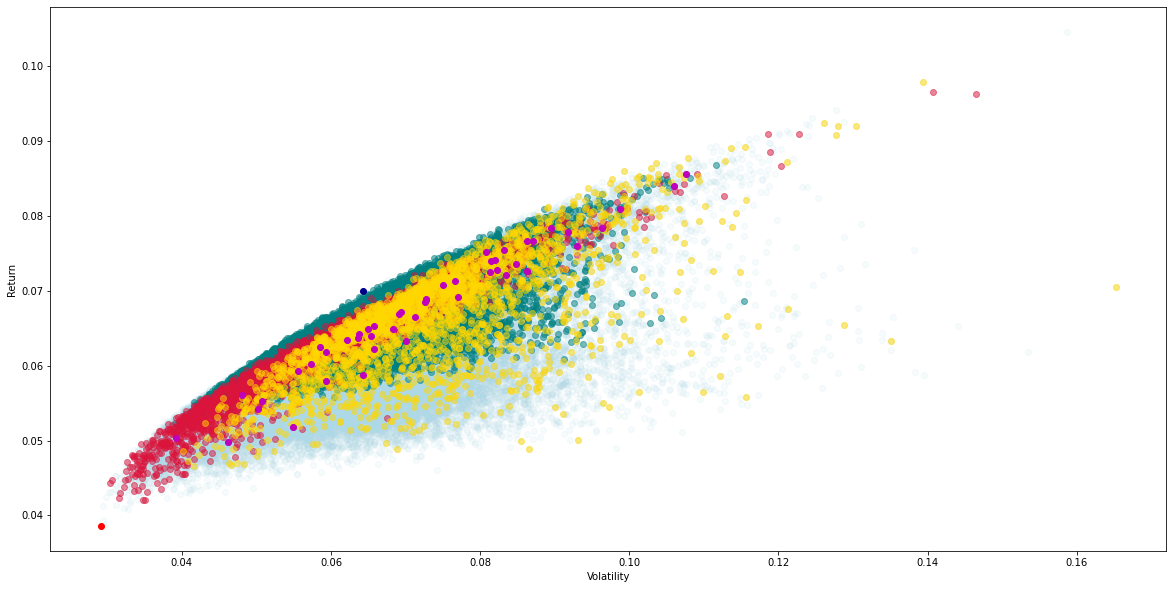
Ahh there we are much better off! In case you are wondering the final weights for that optimal portfolio turns out to be just a 14% weighting to the S&P 500, nearly nil or 0.01% in 3-month T. Bills, 0.4% in US T. Bonds, 55% in Baa Corporate Bonds, 22% in Real Estate, and 8% in Gold. Keep in mind these weightings will change dramatically with changes in real rates and depending on an investors risk aversion. A future post on risk aversion later.
I want to state right now that I have never been a proponent for Gold. But these charts bring up an interesting point about asset classes and diversification. It isn’t so much about finding the greatest return or the lowest risk. It’s the correlation among the asset classes that’s key. Different asset classes will perform differently across time and between each other. It’s the simple fact that uncorrelated asset classes help reduce risk while not sacrificing return. Gold may be historically an awful returning asset class given its risk. But its uncorrelated benefits help maximize a portfolios return per unit of risk.
This has inspired portfolio managers to seek alternative and unique sources of uncorrelated returns. Asset classes like small companies, value companies, Foreign Equities, Emerging Markets, Currencies, all play unique roles in diversified portfolios.
In a future post ill model out, historical mean returns and volatilities across other factors like small cap value, emerging markets and even Bitcoin.
At the end of the day this is all historical analysis. What matters is forward looking expectations of returns and volatility and over what time period. For example, Gold may have been uncorrelated with equities and bonds in the past, but that may not be the case going forward. Maybe Bitcoin will take on that role in the future. Recently it’s been much more correlated to equites and there is chatter of market manipulation. This could change or not.
Finally, this analysis makes us question what truly is risk? Why have humans tended to cling on to Gold during times of crisis? What other ways can we measure risk besides standard deviation? And where can we find nontraditional assets with uncorrelated returns?
All new posts to ponder in the future! Happy investing!