Using Probability Theory to Manage Greed and Fear in a Stock Portfolio
Successful investing has lots to do with historical probabilities (odds), future expectations (psychology, fear, greed, complacency) and random chance (luck). Lets focus on calculating the historical probabilities portion for now, because in order to know where you are going its helpful to know where you have been.
Lets suppose the S&P 500 had just returned a horrible month of greater than negative 10%. We want to calculate this probability. This can be helpful in quantifying rare events (“corrections”, “rallys”) and give confidence to an investor in times of extreme greed or fear.
We will use Python to pull the data and I will provide the code here. Feel free to modify with your own scenarios.
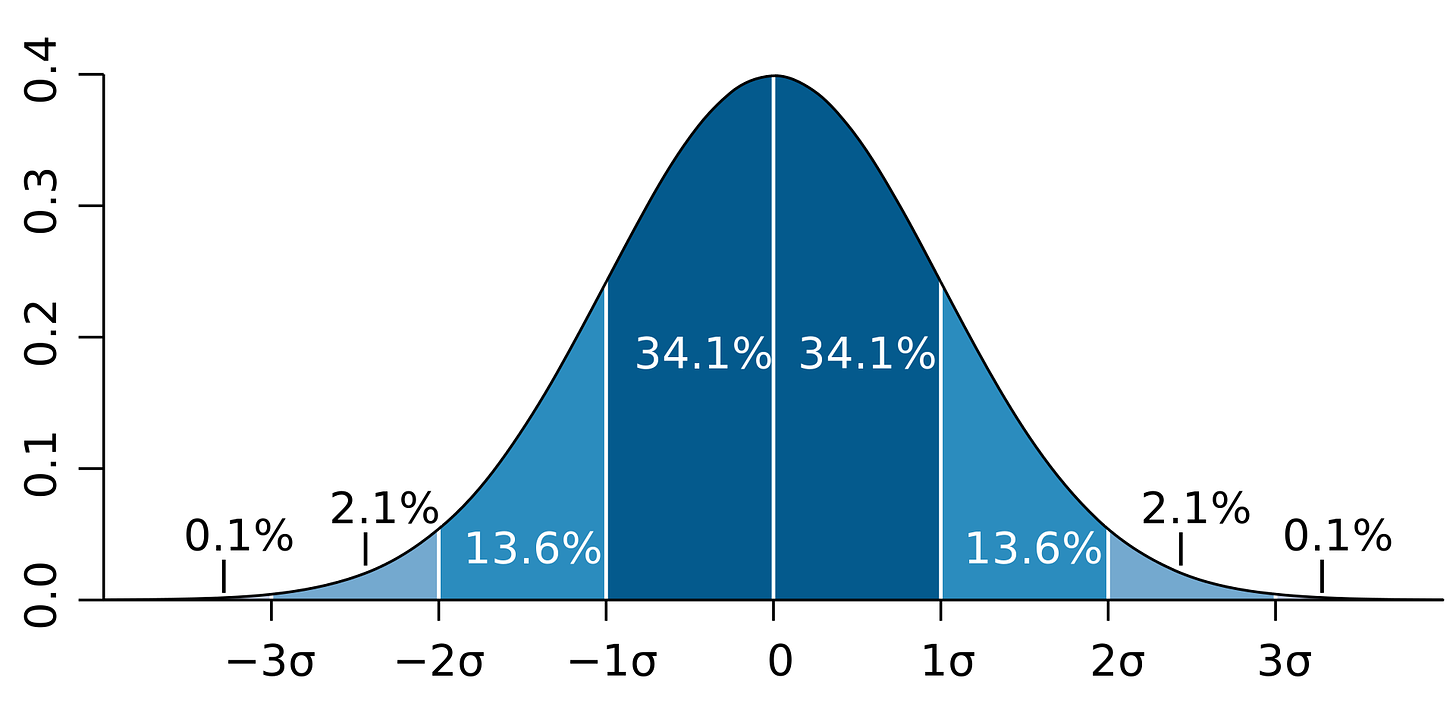
First we need to understand a very common probability distribution used in many sciences, the normal distribution. The normal distribution is a simple model used to describe nature in the real world. For example, many scientist use the normal distribution to describe and visualize the human height of a particular country. Visually the normal distribution looks like a “bell” curve with many of the values congregating around the center and less values found in the far left and right.
The normal distribution is completely described by two parameters mean, μ and standard deviation, σ. We can answer any probability question if we know its mean and standard deviation and make the following probability statements.
Approximately 68 percent of all observations fall in the interval μ ± σ.
Approximately 95 percent of all observations fall in the interval μ ± 2σ.
Approximately 99 percent of all observations fall in the interval μ ± 3σ.
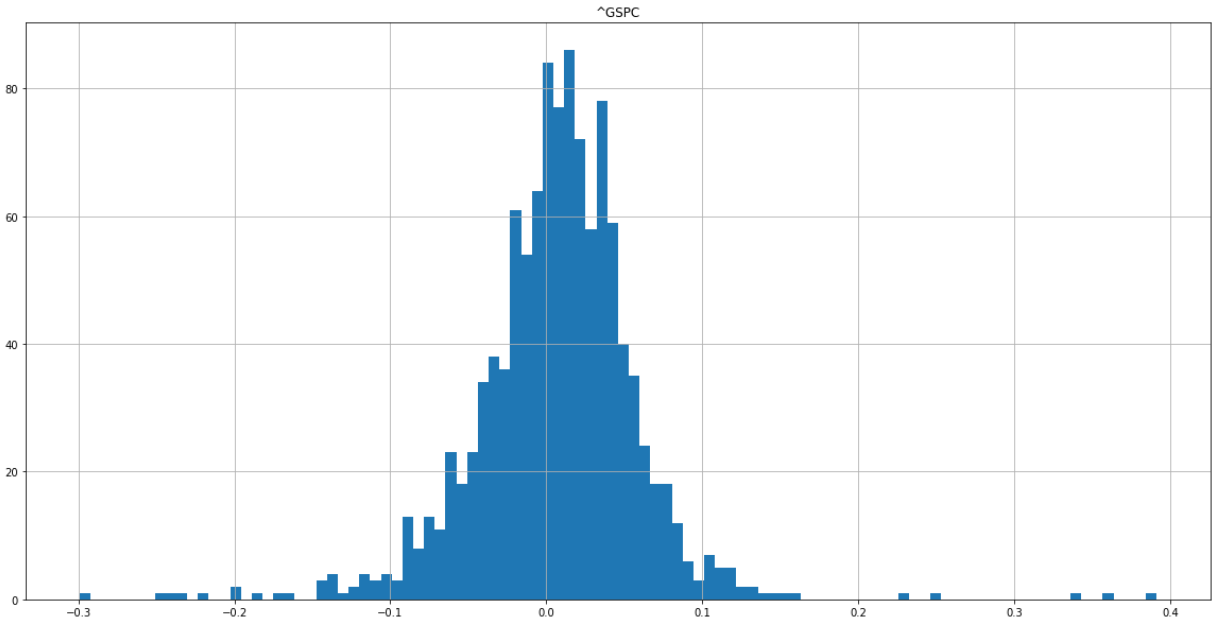
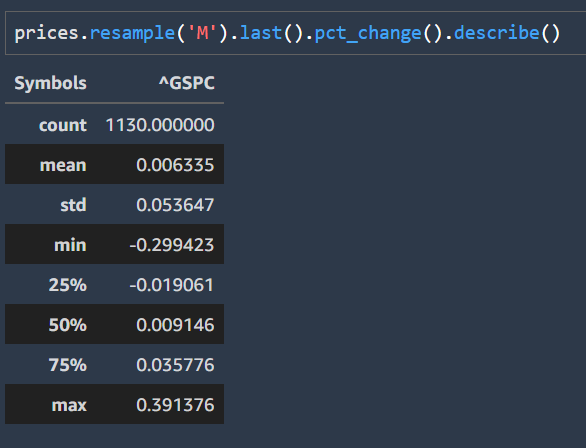
We can use this same model to describe and visualize stock returns. I’ve pulled S&P500 data from yahoo finance starting in 1927 to 2022. I’ve plotted monthly returns below and calculated its mean and standard deviation.
Now that we have the mean and standard deviation of the distribution we can ask some interesting probability questions.
What is the probability the S&P500 will have a greater than negative return of 10% in 1 month? First we need to standardize this variable using the mean and standard deviation we found from our distribution.
(-10% - μ) / σ
(-.10 - .006335 ) / .053647
We get a value of -1.98
Now we can look up a probability table in any classic statistics book or we can just use python to calculate our probability.
import scipy.stats as st
st.norm.cdf(-1.98)
This computes to 0.0238 or a roughly 2.4% probability in a given month the S&P 500 will have a negative return of 10%.
With this information in mind we can now have greater confidence that the following month may not be as bad. More likely an average return should be expected. An investor could even take the opposite view or have comfort in knowing the worse may be over.
Happy Investing!
Some caveats with this model..
The normal distribution model may be a closer fit for quarterly or yearly returns on a diversified equity portfolio. Basically this is not a good model for individual stocks. Also research has shown normal distributions tend to underestimate the probability of extreme returns. Lastly a portfolio with options will skew the distribution. Keep this all in mind.


